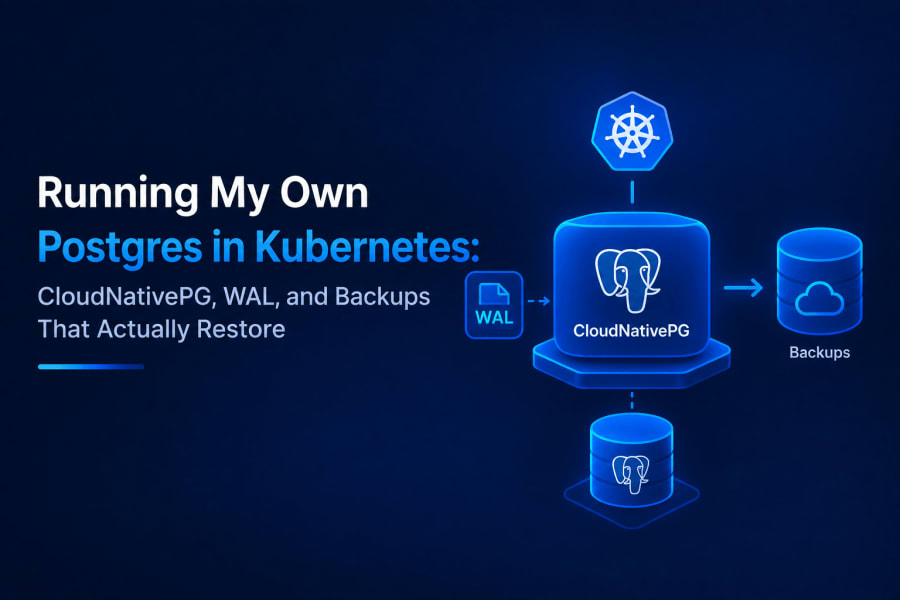
The restore finished in under a minute. I’d deleted a test cluster on purpose, pointed a fresh one at the same object storage bucket, and watched CloudNativePG pull down a base backup and replay the WAL on top of it. Healthy state, all data back, faster than I expected. I remember feeling pretty good about myself for about ten minutes.
Then the app itself broke anyway. Not the database, the database was fine, it was a stale tenant lookup sitting in Redis for 24 hours that kept pointing the backend at the old connection details after the cutover. Unable to start a transaction in the given time, over and over, until I thought to clear one cache key. The database had never been the fragile part. Everything hanging off of it was.
Why I stopped paying someone else to run Postgres
CloudNativePG is a Kubernetes operator that runs PostgreSQL as a native, self-managed resource inside your own cluster, handling the StatefulSet, failover, and backup lifecycle for you instead of a third party hosting it behind an API. I’d been running Postgres on a managed provider before this, the kind where backups are a checkbox you tick once and never think about again. That’s genuinely fine for a lot of projects. But once the app moved onto its own Kubernetes cluster, running the database somewhere else meant network hops, a separate bill, and zero control over when maintenance happened.
You describe a Cluster resource, and CloudNativePG manages the StatefulSet, the failover logic if you have more than one replica, and the backup lifecycle through a plugin interface. The tradeoff is you now own the parts a managed provider used to hide from you, and WAL archiving is the biggest one of those parts.
The cluster itself is smaller than I expected
Here’s roughly what the Cluster resource looks like once you strip out the environment-specific bits:
apiVersion: postgresql.cnpg.io/v1
kind: Cluster
metadata:
  name: app-pg
spec:
  instances: 1
  imageName: ghcr.io/cloudnative-pg/postgresql:17.11-standard-trixie
  storage:
    size: 20Gi
    storageClass: local-path
  bootstrap:
    initdb:
      database: app_platform
      owner: platform_app
      postInitApplicationSQL:
        - "REVOKE CONNECT ON DATABASE app_platform FROM PUBLIC"
  managed:
    roles:
      - name: platform_admin
        ensure: present
        login: true
        createdb: true
        createrole: true
instances: 1. That’s the honest number, and I’m not going to pretend otherwise, this runs on a single node with no automatic failover. If the node or the volume dies, recovery means restoring from backup, not switching to a standby. That’s a real limitation and the first thing on my list to fix, but it’s also not the disaster it sounds like once you understand what the backup story actually covers.
The postInitApplicationSQL line is the kind of thing that looks paranoid until you think about why it’s there. Postgres grants CONNECT on every database to PUBLIC by default, which means any role that can log in at all can also connect to your control-plane database unless you explicitly revoke it. One line, and that door’s shut. Also worth pointing out what’s not in this file: no hand-tuned postgresql.parameters, no custom max_connections, no shared_buffers tweak. Everything except storage size and instance count runs on the operator’s defaults, and I’d rather admit that than pretend I benchmarked my way into custom values I didn’t actually need yet.
WAL is the backup, the backup job is just the other half
Write-ahead logging (WAL) is Postgres recording every change to a durable log before it touches the actual table files, flushing that log to disk first and only then applying the change to the data pages. That’s what makes crash recovery possible: if the process dies mid-write, Postgres replays the WAL on restart and gets back to a consistent state.
The part that matters for backups is that continuous archiving is really just shipping that same WAL stream somewhere durable, in addition to letting Postgres use it locally. Take one full copy of the data directory (a base backup), keep archiving every WAL segment after it, and you can reconstruct the database as it existed at any point covered by that WAL, not just at the moment the base backup was taken.
CloudNativePG hands this off to a Barman Cloud plugin instead of writing directly to WAL archiving itself:
apiVersion: postgresql.cnpg.io/v1
kind: Cluster
metadata:
  name: app-pg
spec:
  plugins:
    - name: barman-cloud.cloudnative-pg.io
      isWALArchiver: true
      parameters:
        barmanObjectName: app-pg-backups
---
apiVersion: barmancloud.cnpg.io/v1
kind: ObjectStore
metadata:
  name: app-pg-backups
spec:
  retentionPolicy: "30d"
  configuration:
    destinationPath: "s3://my-backup-bucket"
    endpointURL: "https://objectstore.example.com"
    wal:
      compression: gzip
    data:
      compression: gzip
    s3Credentials:
      accessKeyId:
        name: app-pg-backup-s3
        key: ACCESS_KEY_ID
      secretAccessKey:
        name: app-pg-backup-s3
        key: ACCESS_SECRET_KEY
This is the newer plugin-based architecture, the older barmanObjectStore field bolted directly onto the Cluster spec still works but is on its way out. Splitting it into a separate ObjectStore resource means the same store definition can back more than one cluster, and the Cluster just points at it by name.
retentionPolicy: "30d" is doing less than the name suggests, it doesn’t delete anything mid-recovery-window, it just tells the retention job how far back to keep base backups and their associated WAL before cleaning up. I run 30 days in production and 14 in staging, mostly because staging doesn’t need a month of history and there’s no reason to pay for the storage.
The default archive timeout is 5 minutes, meaning a completed transaction can sit unarchived for up to 5 minutes before CNPG forces the WAL segment out regardless of how full it is. That number is your RPO. If the node dies right now, you can lose up to 5 minutes of committed writes, not because Postgres lost them, but because they hadn’t left the node yet. I haven’t lowered it. Lowering it means more, smaller WAL segments shipped more often, which is a real tradeoff against object storage request costs, and 5 minutes has been fine for what this app actually needs.
A restore is a new cluster, not a repair
The thing that took me longest to internalize is that CloudNativePG never patches a broken cluster back to health. Recovery means bootstrapping an entirely new Cluster object that reads from the same object storage:
apiVersion: postgresql.cnpg.io/v1
kind: Cluster
metadata:
  name: app-pg-restore
spec:
  instances: 1
  storage:
    size: 20Gi
  bootstrap:
    recovery:
      source: origin
      recoveryTarget:
        targetTime: "2026-09-18T14:30:00Z"
  externalClusters:
    - name: origin
      plugin:
        name: barman-cloud.cloudnative-pg.io
        parameters:
          barmanObjectName: app-pg-backups
          serverName: app-pg
Comment out recoveryTarget and it just restores to the latest available point. Fill it in and you get point-in-time recovery to the second. I deliberately leave the plugins block off this restore manifest, because if the new cluster started archiving into the same bucket under the same server name while I was still verifying it, I’d end up with two clusters’ WAL interleaved under one name. Easier to just not create that problem.
On roughly 25MB of data, this whole thing, spin up the pod, pull the base backup, replay WAL, reach “Cluster in healthy state”, took under a minute. That number will grow with your data size and however much WAL there is to replay past the base backup, so don’t take it as a universal figure. But it told me the mechanism works, which is the only thing a restore test is actually for.
Here’s the part that genuinely surprised me, and it has nothing to do with Postgres. I run this cluster through ArgoCD, everything declared in git. The Cluster manifest in git uses bootstrap.initdb, because that’s how you create it the first time. If someone runs kubectl delete cluster app-pg by accident, or a sync gets weird, ArgoCD’s job is to make the live cluster match git again. Which it will, faithfully, by creating a brand new empty database using initdb. Not a restore. An empty database that reports itself as perfectly healthy.
flowchart LR
    Git[Git: Cluster manifest]
    ArgoCD[ArgoCD]
    Live[Live Cluster]
    ObjStore[(Object storage: base backups + WAL)]
    Empty([Empty DB via initdb])

    Git --> ArgoCD
    ArgoCD -->|sync| Live
    Live -->|WAL + base backups| ObjStore
    Live -.->|deleted, no safeguard| Empty
The fix is two annotations, argocd.argoproj.io/sync-options: Delete=false,Prune=false on the Cluster and ObjectStore resources, plus prune: false on the ArgoCD Application itself. That doesn’t stop a deliberate kubectl delete, nothing really does, but it stops the automated tooling from ever being the thing that erases a live database while trying to be helpful.
Alerts, without a metrics stack
You don’t need Prometheus or Grafana to catch a CNPG cluster in trouble, a Kubernetes CronJob that polls the Cluster resource’s status with kubectl on a schedule and posts to a webhook when something looks wrong covers the same failure modes with no metrics stack at all. I don’t run Prometheus in this cluster. That’s not a recommendation, if I already had Prometheus and Alertmanager running for other things, I’d wire Postgres into it and get proper dashboards, histogram buckets on replication lag, and Grafana panels instead of what I’m about to describe. But I didn’t have that stack yet, and I needed something before I built one, so this is what filled the gap.
A Kubernetes CronJob runs every 15 minutes and shells out to kubectl to check a handful of conditions on the Cluster resource: the phase is “Cluster in healthy state”, the ContinuousArchiving condition is true, readyInstances matches the spec, the newest backup isn’t older than 36 hours, and disk usage on the data volume (read via df through kubectl exec) is under 80%.
#!/bin/sh
STATUS=$(kubectl get cluster app-pg -o jsonpath='{.status.phase}')
if [ "$STATUS" != "Cluster in healthy state" ]; then
  curl -X POST "$WEBHOOK_URL" \
    -H 'Content-Type: application/json' \
    -d "{\"text\": \"app-pg is unhealthy: $STATUS\"}"
  exit 1
fi
One condition needed a real fix rather than a naive check: LastBackupSucceeded briefly clears while a backup is actually running, which looked like a failure the first time I saw it until I realized it was just Postgres telling the truth about being mid-backup. The script has to skip that check while a backup is in flight instead of firing a false alarm every night at 20:30 UTC.
If the alert fires, it posts to a webhook and exits non-zero, on purpose, with no retry configured. A retry would just send the same Slack message twice, and kubectl get jobs showing a failed run is itself a secondary signal if the webhook happens to be down too. It’s not sophisticated. It’s a shell script and a cron schedule, and it’s caught real WAL archiving stalls before I’d have noticed otherwise. If you already run Prometheus, postgres_exporter plus Alertmanager rules on pg_stat_archiver gets you the same coverage with actual history and graphs behind it, which is where this is heading eventually.
Where this still falls short
One instance, no automatic failover, is the honest gap. A node loss right now means a restore, not a switchover, and a restore has a floor of however long it takes to pull the base backup and catch up on WAL. The local-path storage class also isn’t enforcing the 20Gi I asked for as a real quota, it’s just a directory on the node’s disk, so a runaway table could, in theory, fill the node before my 80% alert even has a chance to fire cleanly. Both of those are next on the list, in that order.
None of this is exotic. It’s an operator, an object store, and a cron job, and it’s held up fine for a single-node production database that I’m the only one responsible for.
I’m writing a second post on top of this one soon, about how this same cluster ends up hosting a separate database per tenant instead of one shared schema, and what that does to connection limits and isolation once you’ve got more than one customer’s data sitting on the same box.
References
- CloudNativePG: Backup — backup architecture, the Barman Cloud plugin, and
ScheduledBackup - CloudNativePG: Recovery — bootstrapping a cluster from an object store,
recoveryTarget, point-in-time recovery - PostgreSQL: Write-Ahead Logging (WAL) — why WAL exists and how it enables crash recovery and continuous archiving